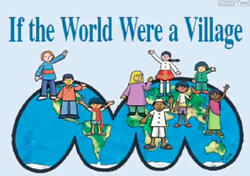
To make data handling more interesting we are using the context of this famous social studies book.
Today we watched the clips and thought about how we could present this information for more easy comparison. We make bar charts or pictograms of the Village Nationalities using our dividing by 10 and fraction skills as well as working out scales. We will try doing the same for the languages spoken.
We will go on to interpret the data and draw conclusions as we will collect the same data on our the people in our Numeracy class to see if we are representative of the whole world.
Click on the above picture for the video. Here are a couple more links too:
http://v.youku.com/v_show/id_XMzU5NTY0NzU2.html
http://www.iftheworldwereavillage.com/video.html
http://www.tudou.com/programs/view/g5W7dD6nrXQ/

 RSS Feed